
Published November 7, 2026
Track your outbound pipeline through to revenue

Sam Tuke
Chief Executive Officer
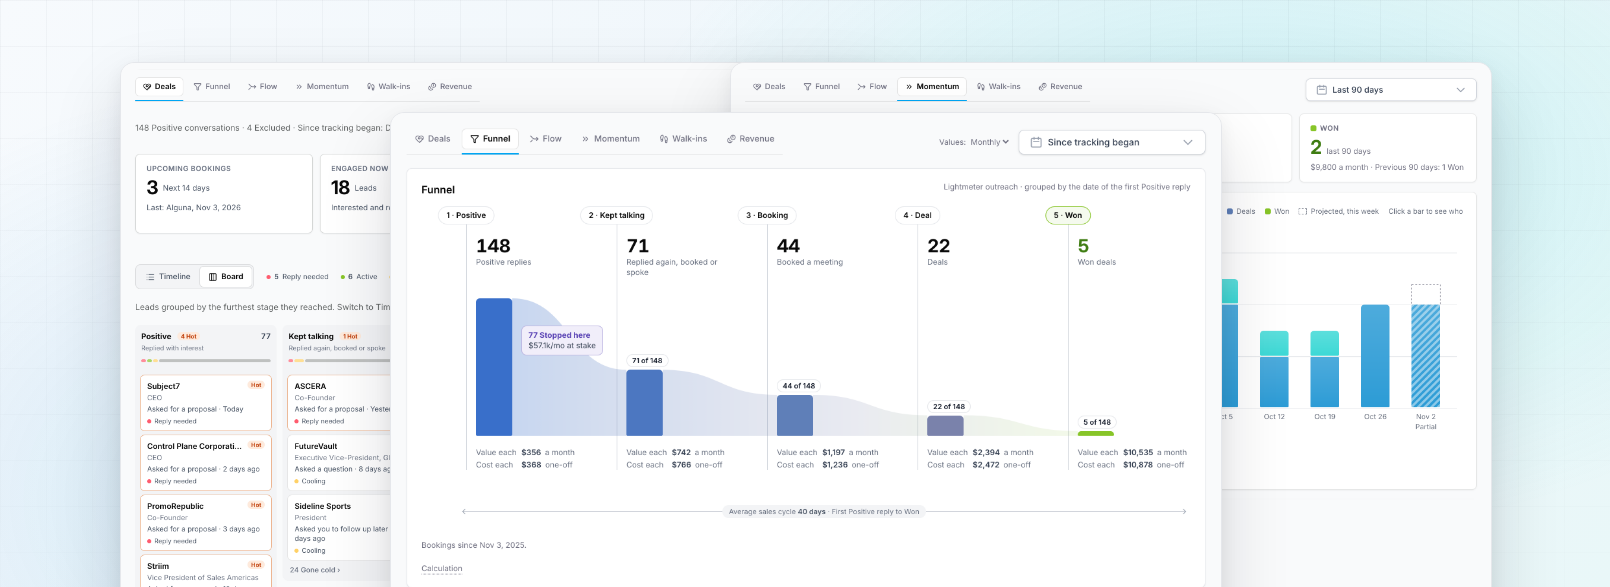
Which positive replies became revenue? Which conversations still need your attention?
You can now follow your outbound pipeline through to revenue in Lightmeter’s Commercial reports. Start with a promising reply, see how the conversation develops, and review the attributed deals it leads to. When a conversation stalls, you can see where to pick it up.
Find the conversations worth following up
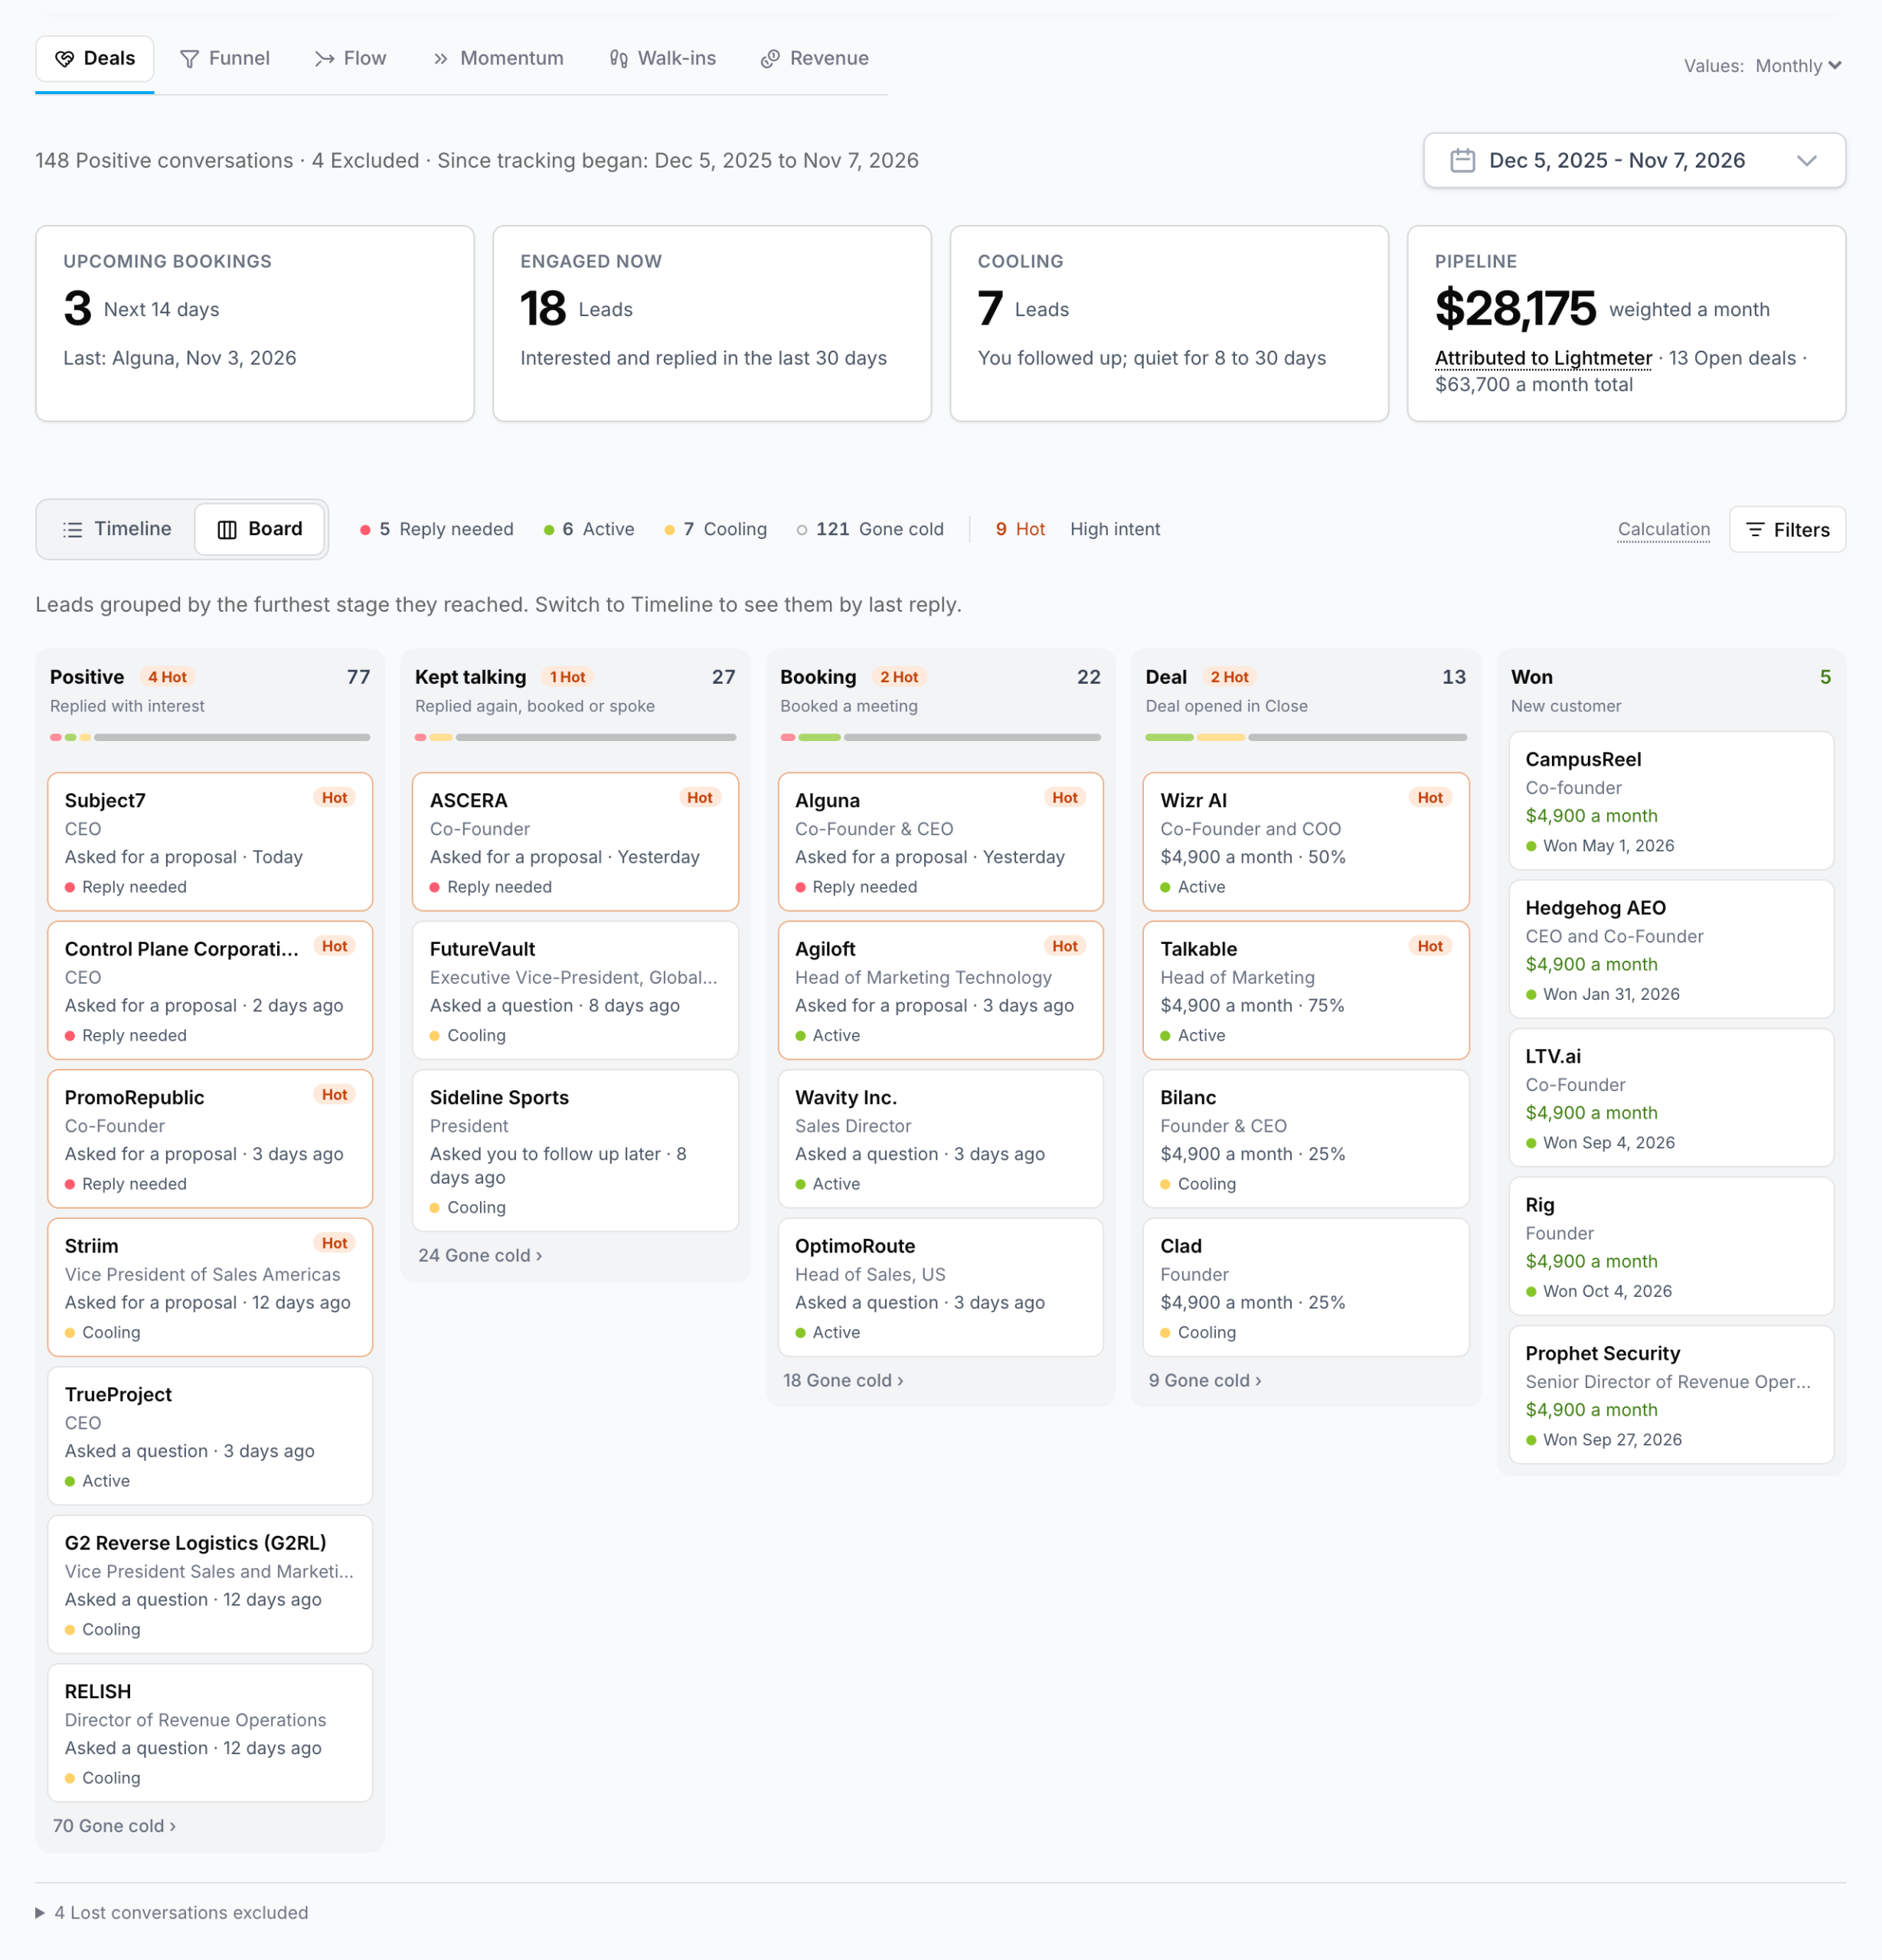
Open Deals to see where each positive conversation stands. Hot highlights high intent in the latest classified reply. Reply needed shows where a recent lead reply is waiting for an answer. Cooling and Gone cold help you find conversations that have lost activity.
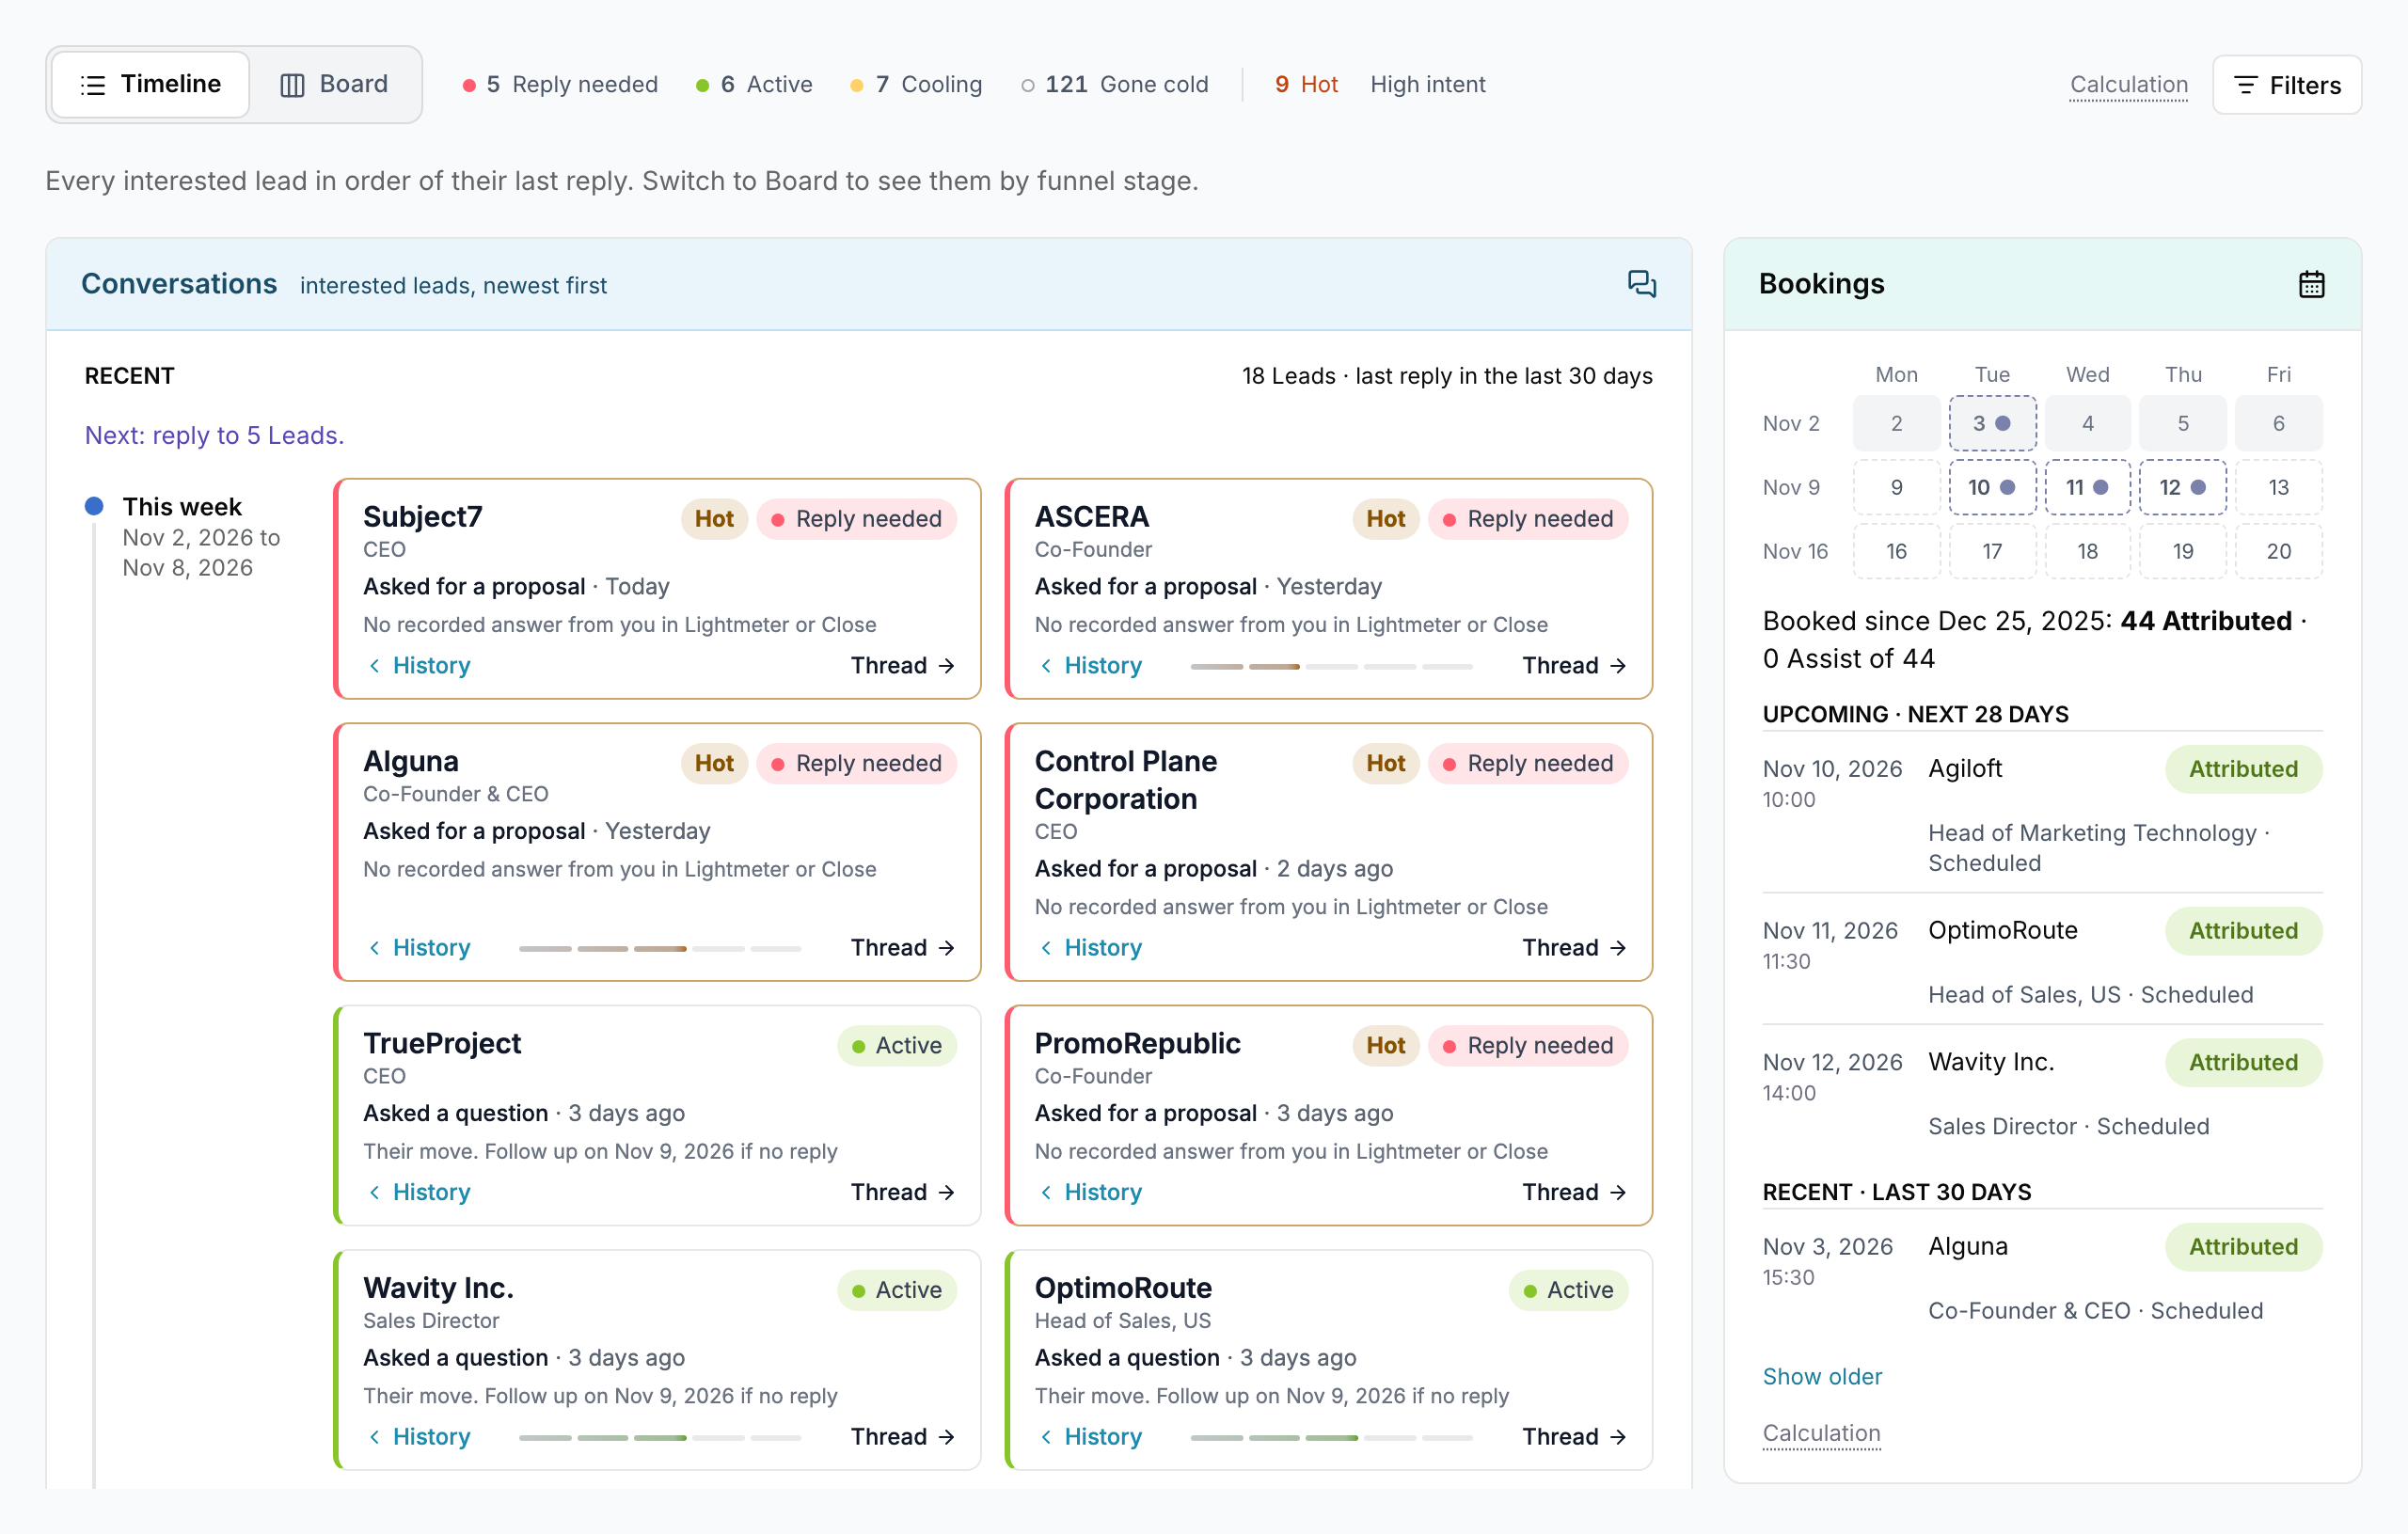
The Board groups conversations by the furthest milestone reached. The Timeline gives you another way to review them, with next steps alongside the conversation. Open an available thread in the Unibox when you’re ready to reply.
With a connected CRM, you can see the attributed deals associated with those conversations. Without a CRM, you can record a deal as Open or Won, or mark a conversation Lost or Not a fit.
See what your replies turn into
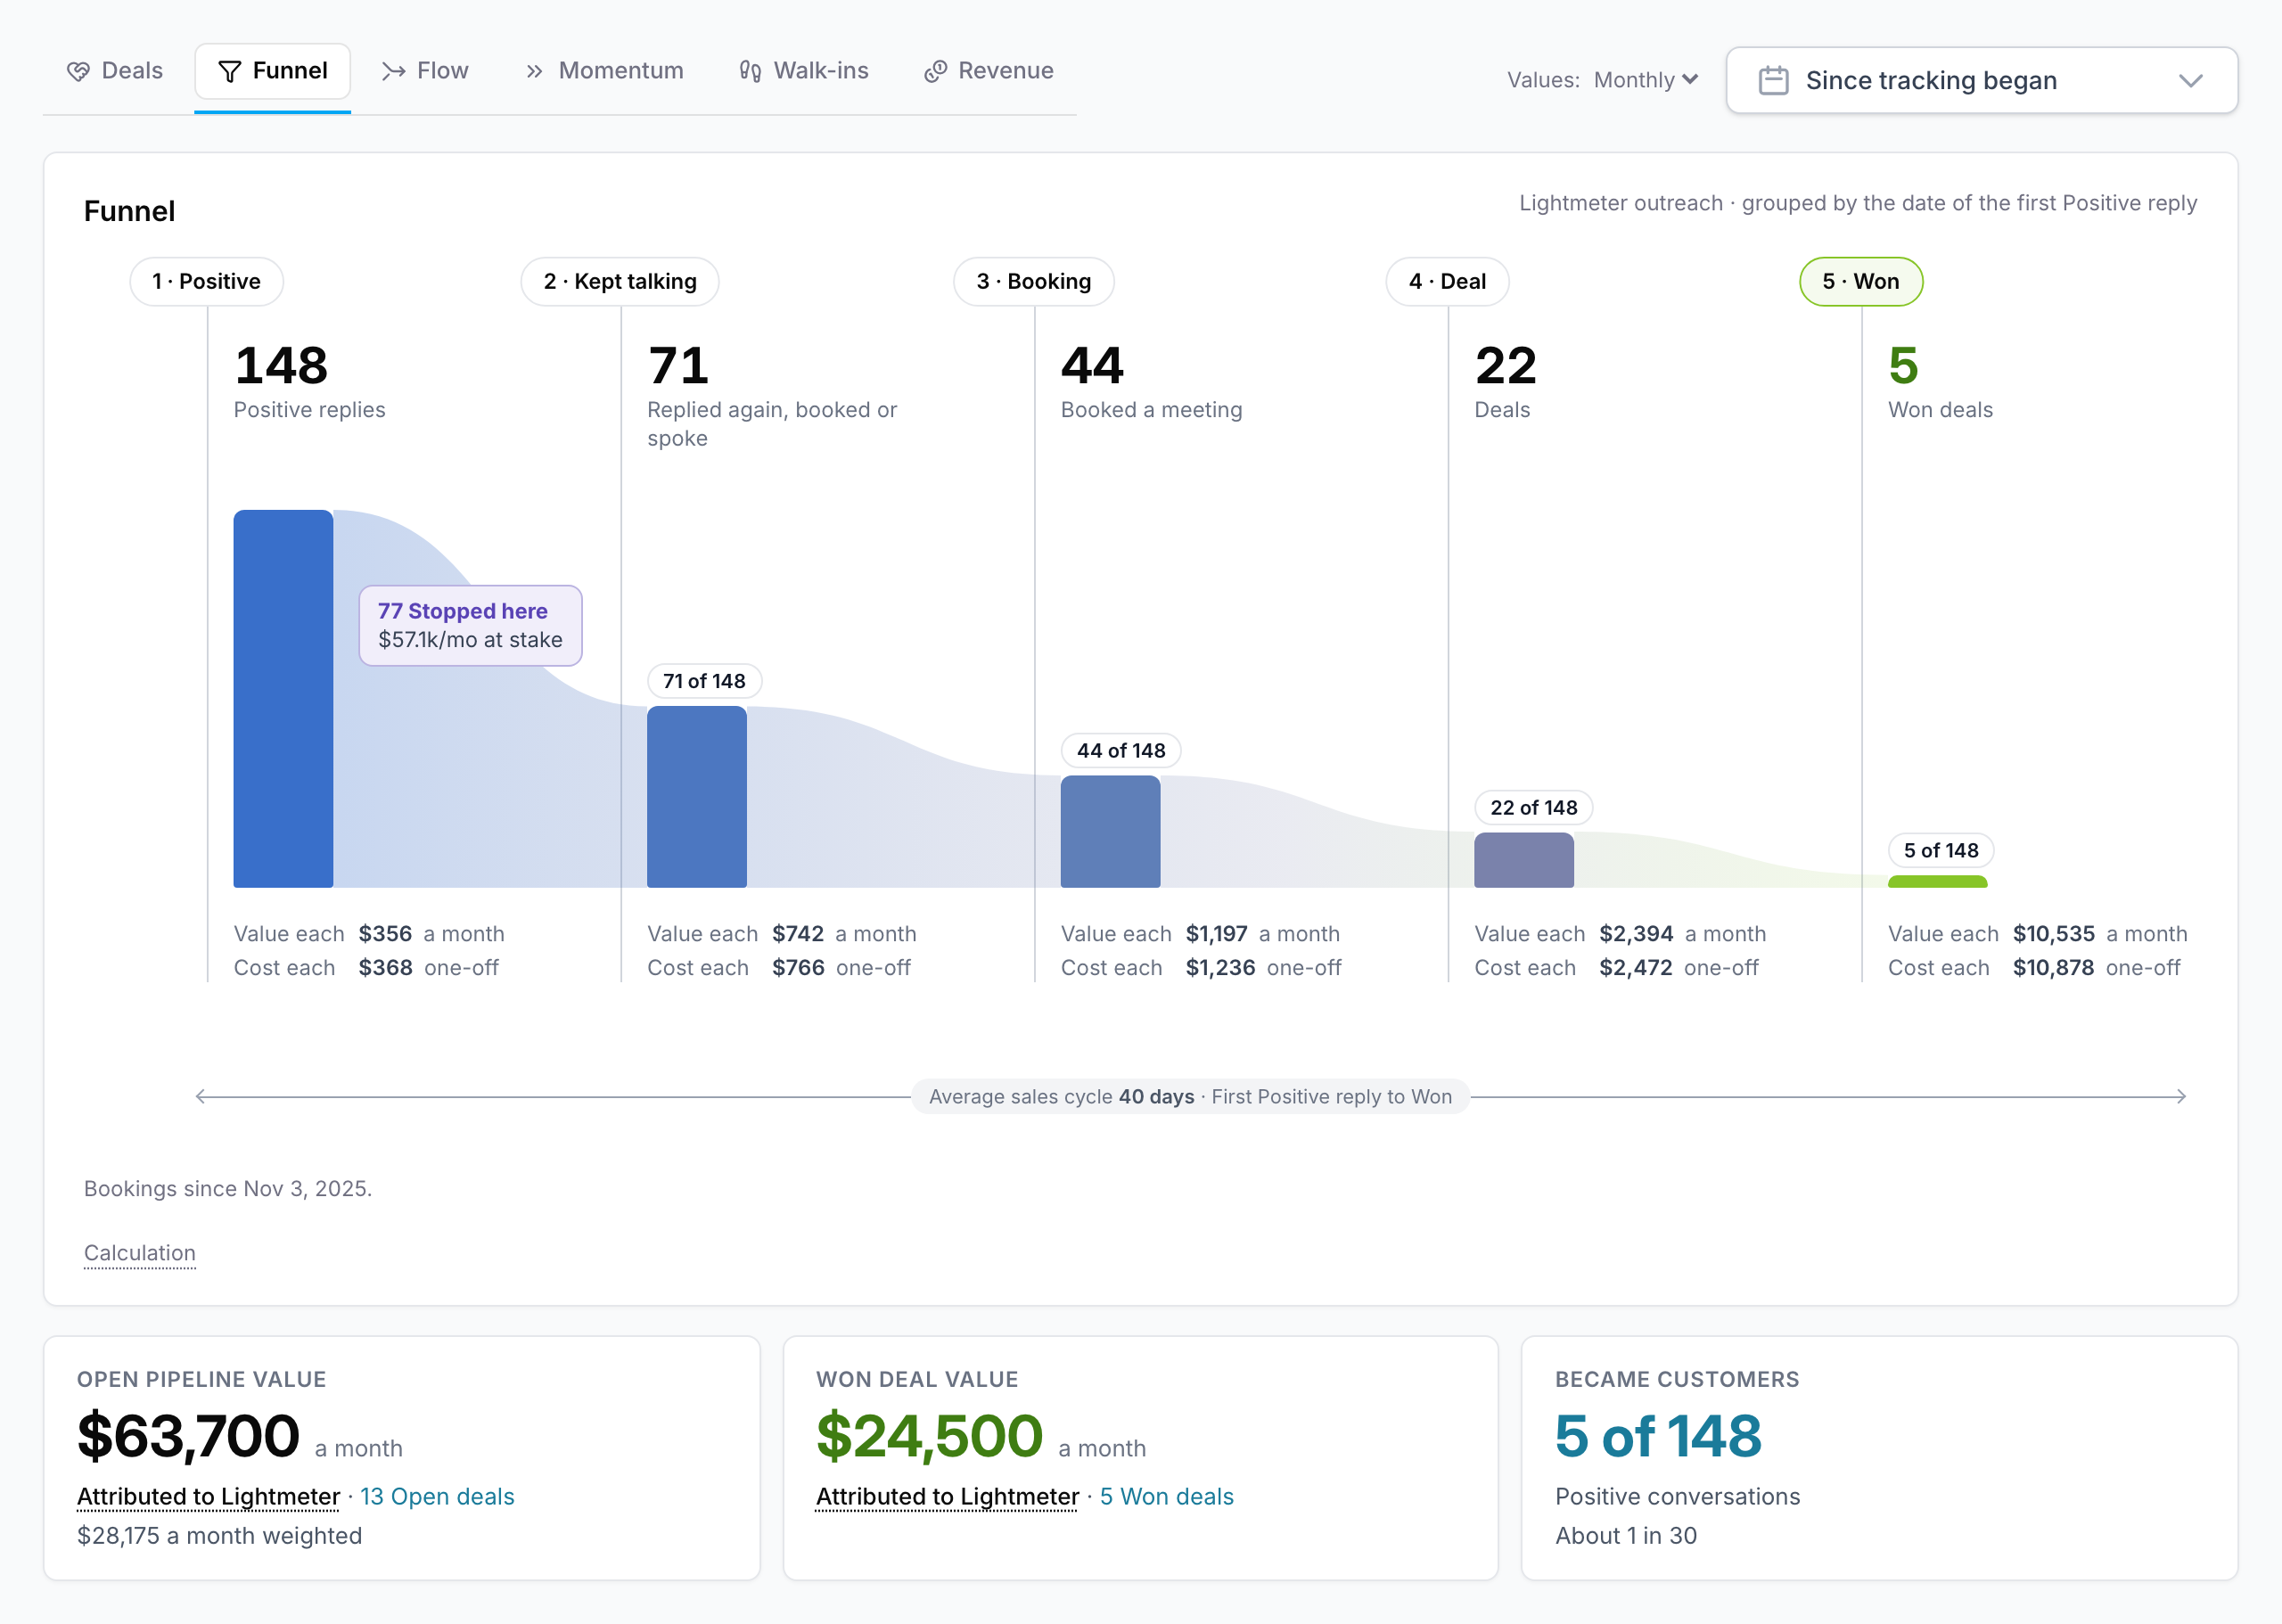
Funnel connects positive conversations to commercial outcomes. See how many reached later milestones and compare results by outreach month. Alongside those counts, review open pipeline and won value.
This helps you ask a more useful question than how many replies arrived: are those replies developing into business? If conversations reach Booking but don’t reach Deal, you know which part of the journey to investigate.
Counts describe different things at different stages. Early stages count conversations; Deal and Won count attributed deals. A conversation can lead to more than one deal. Calculation explains the basis and shows where missing history limits what you can conclude.
Find where conversations drop off
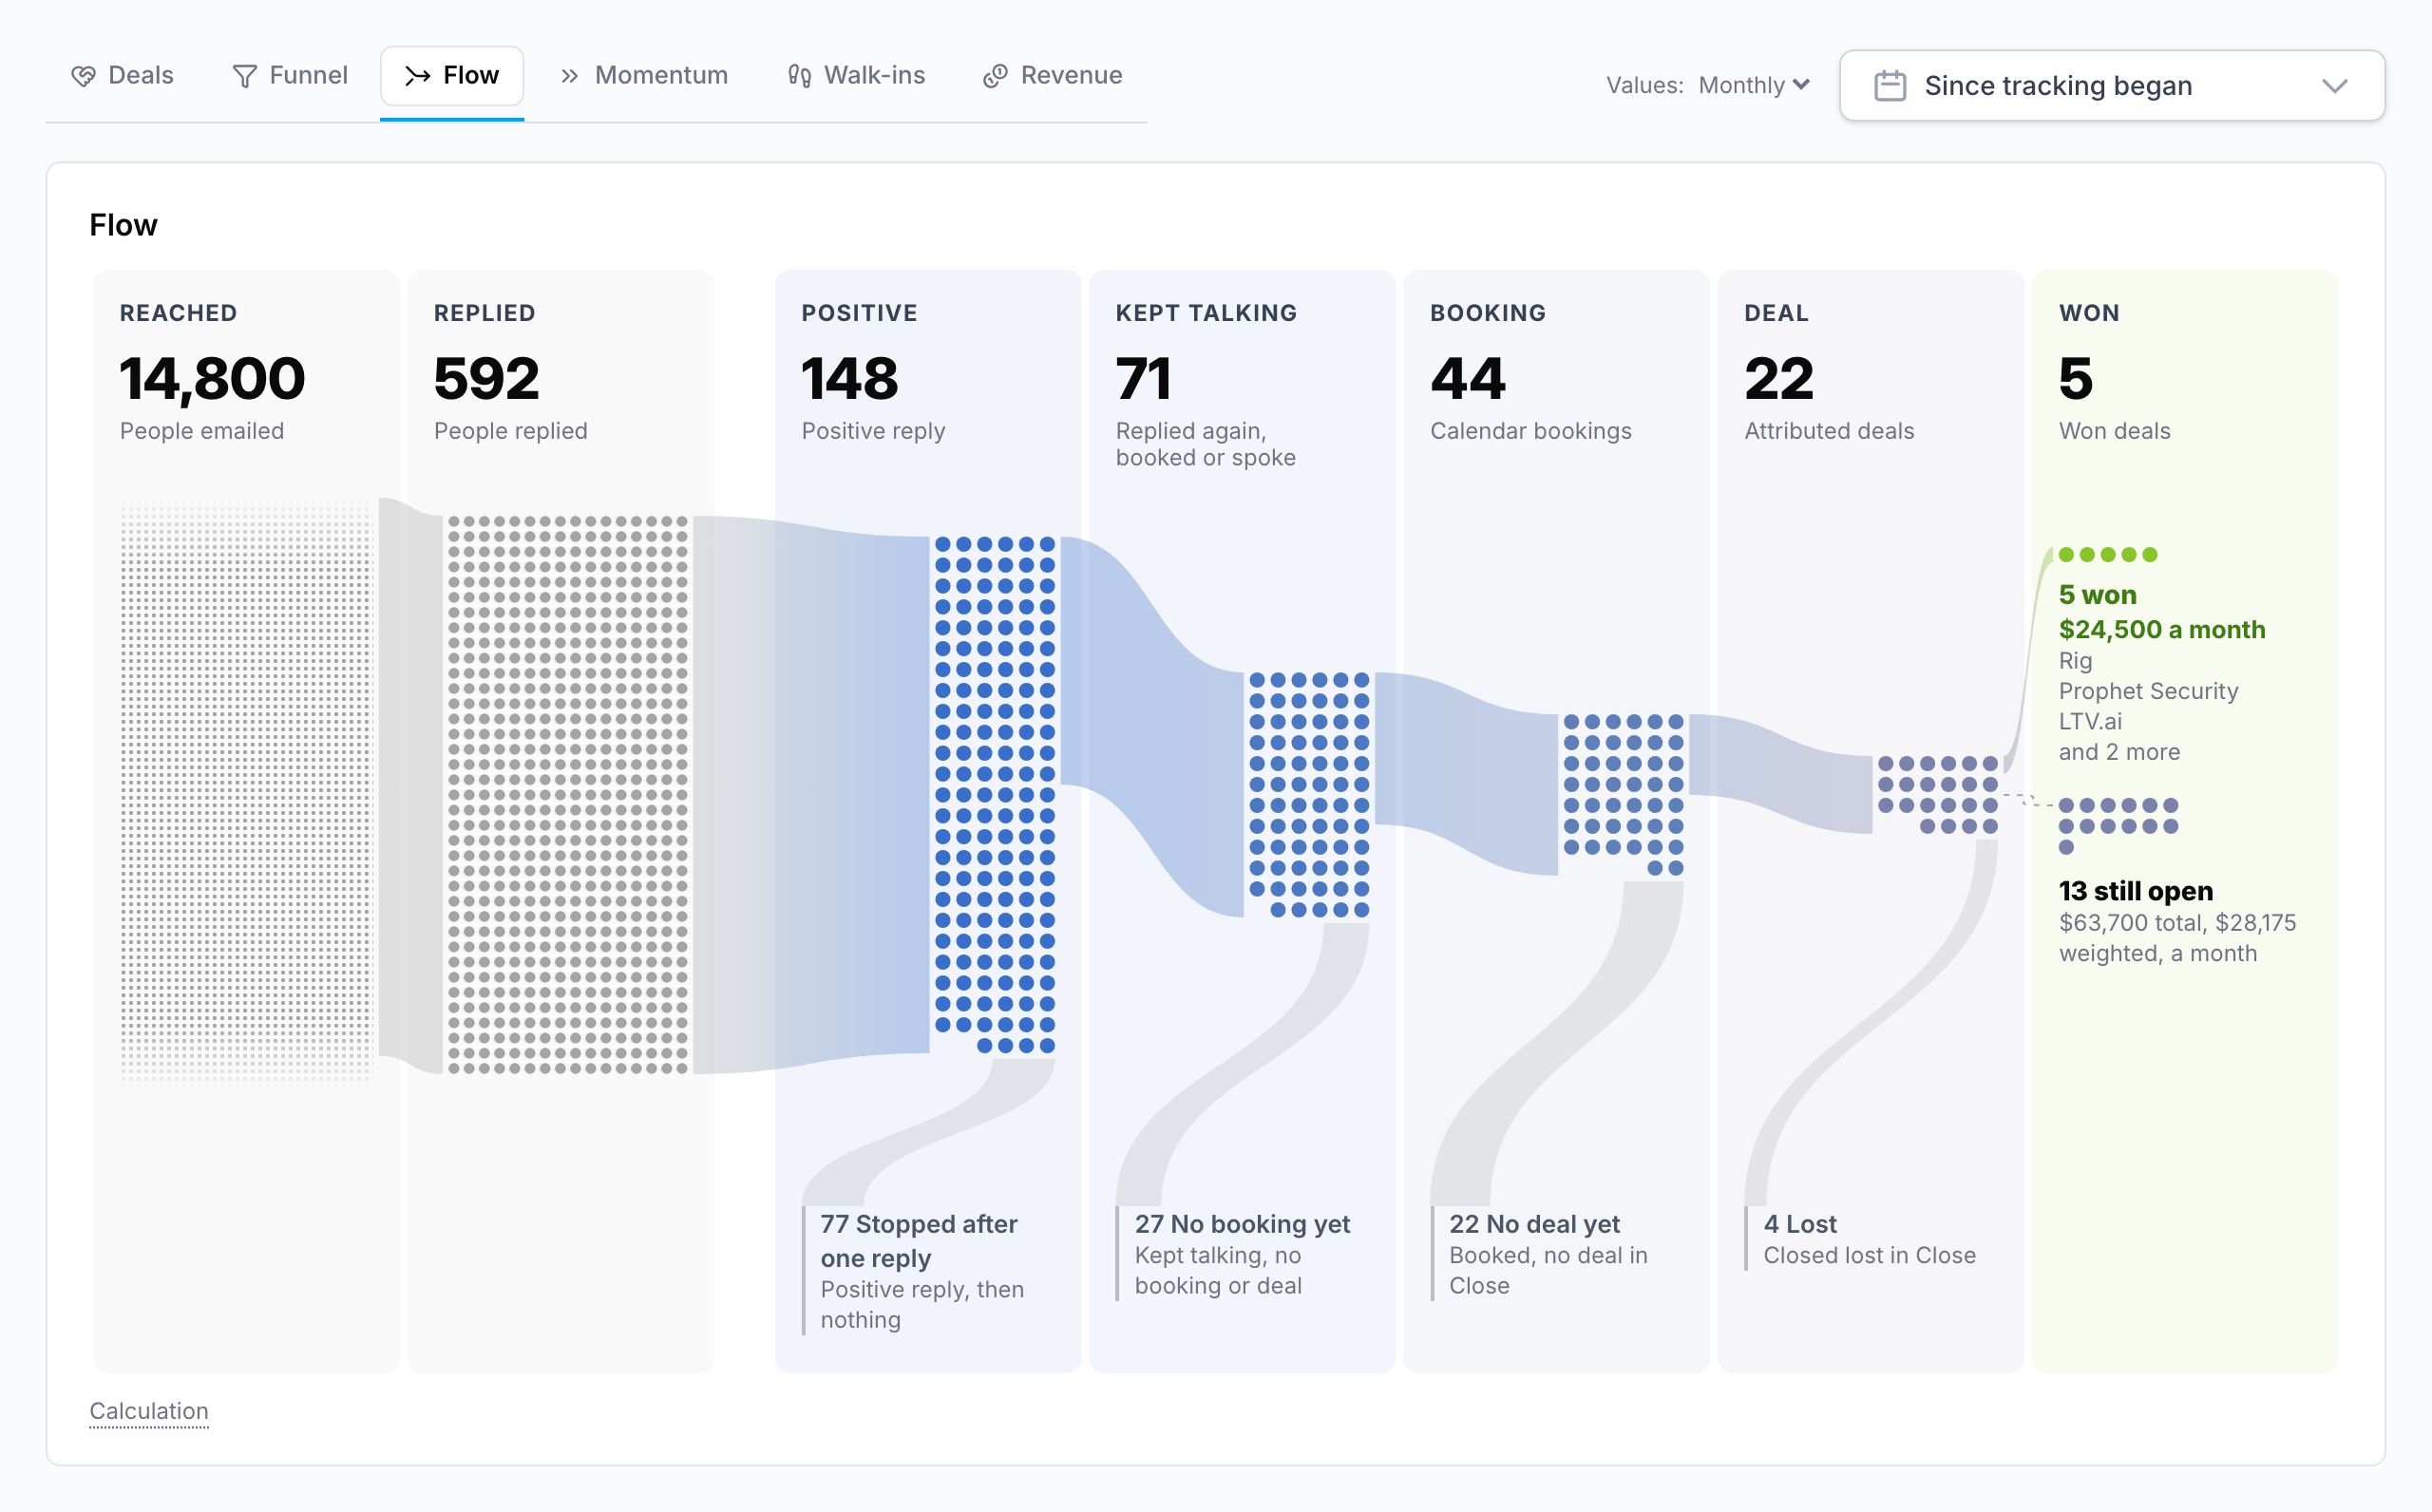
Flow shows Reached and Replied alongside the path from Positive towards Won. See where positive conversations stop progressing. It gives you a visual way to locate a gap before deciding which conversations need closer attention.
Flow and Funnel use the same definitions. Reached and Replied are dated by the first campaign send; Positive and later stages use the first Positive reply. Calculation explains the difference, so you don’t mistake differently dated groups for a single conversion rate.
Compare the pipeline your outreach develops over time
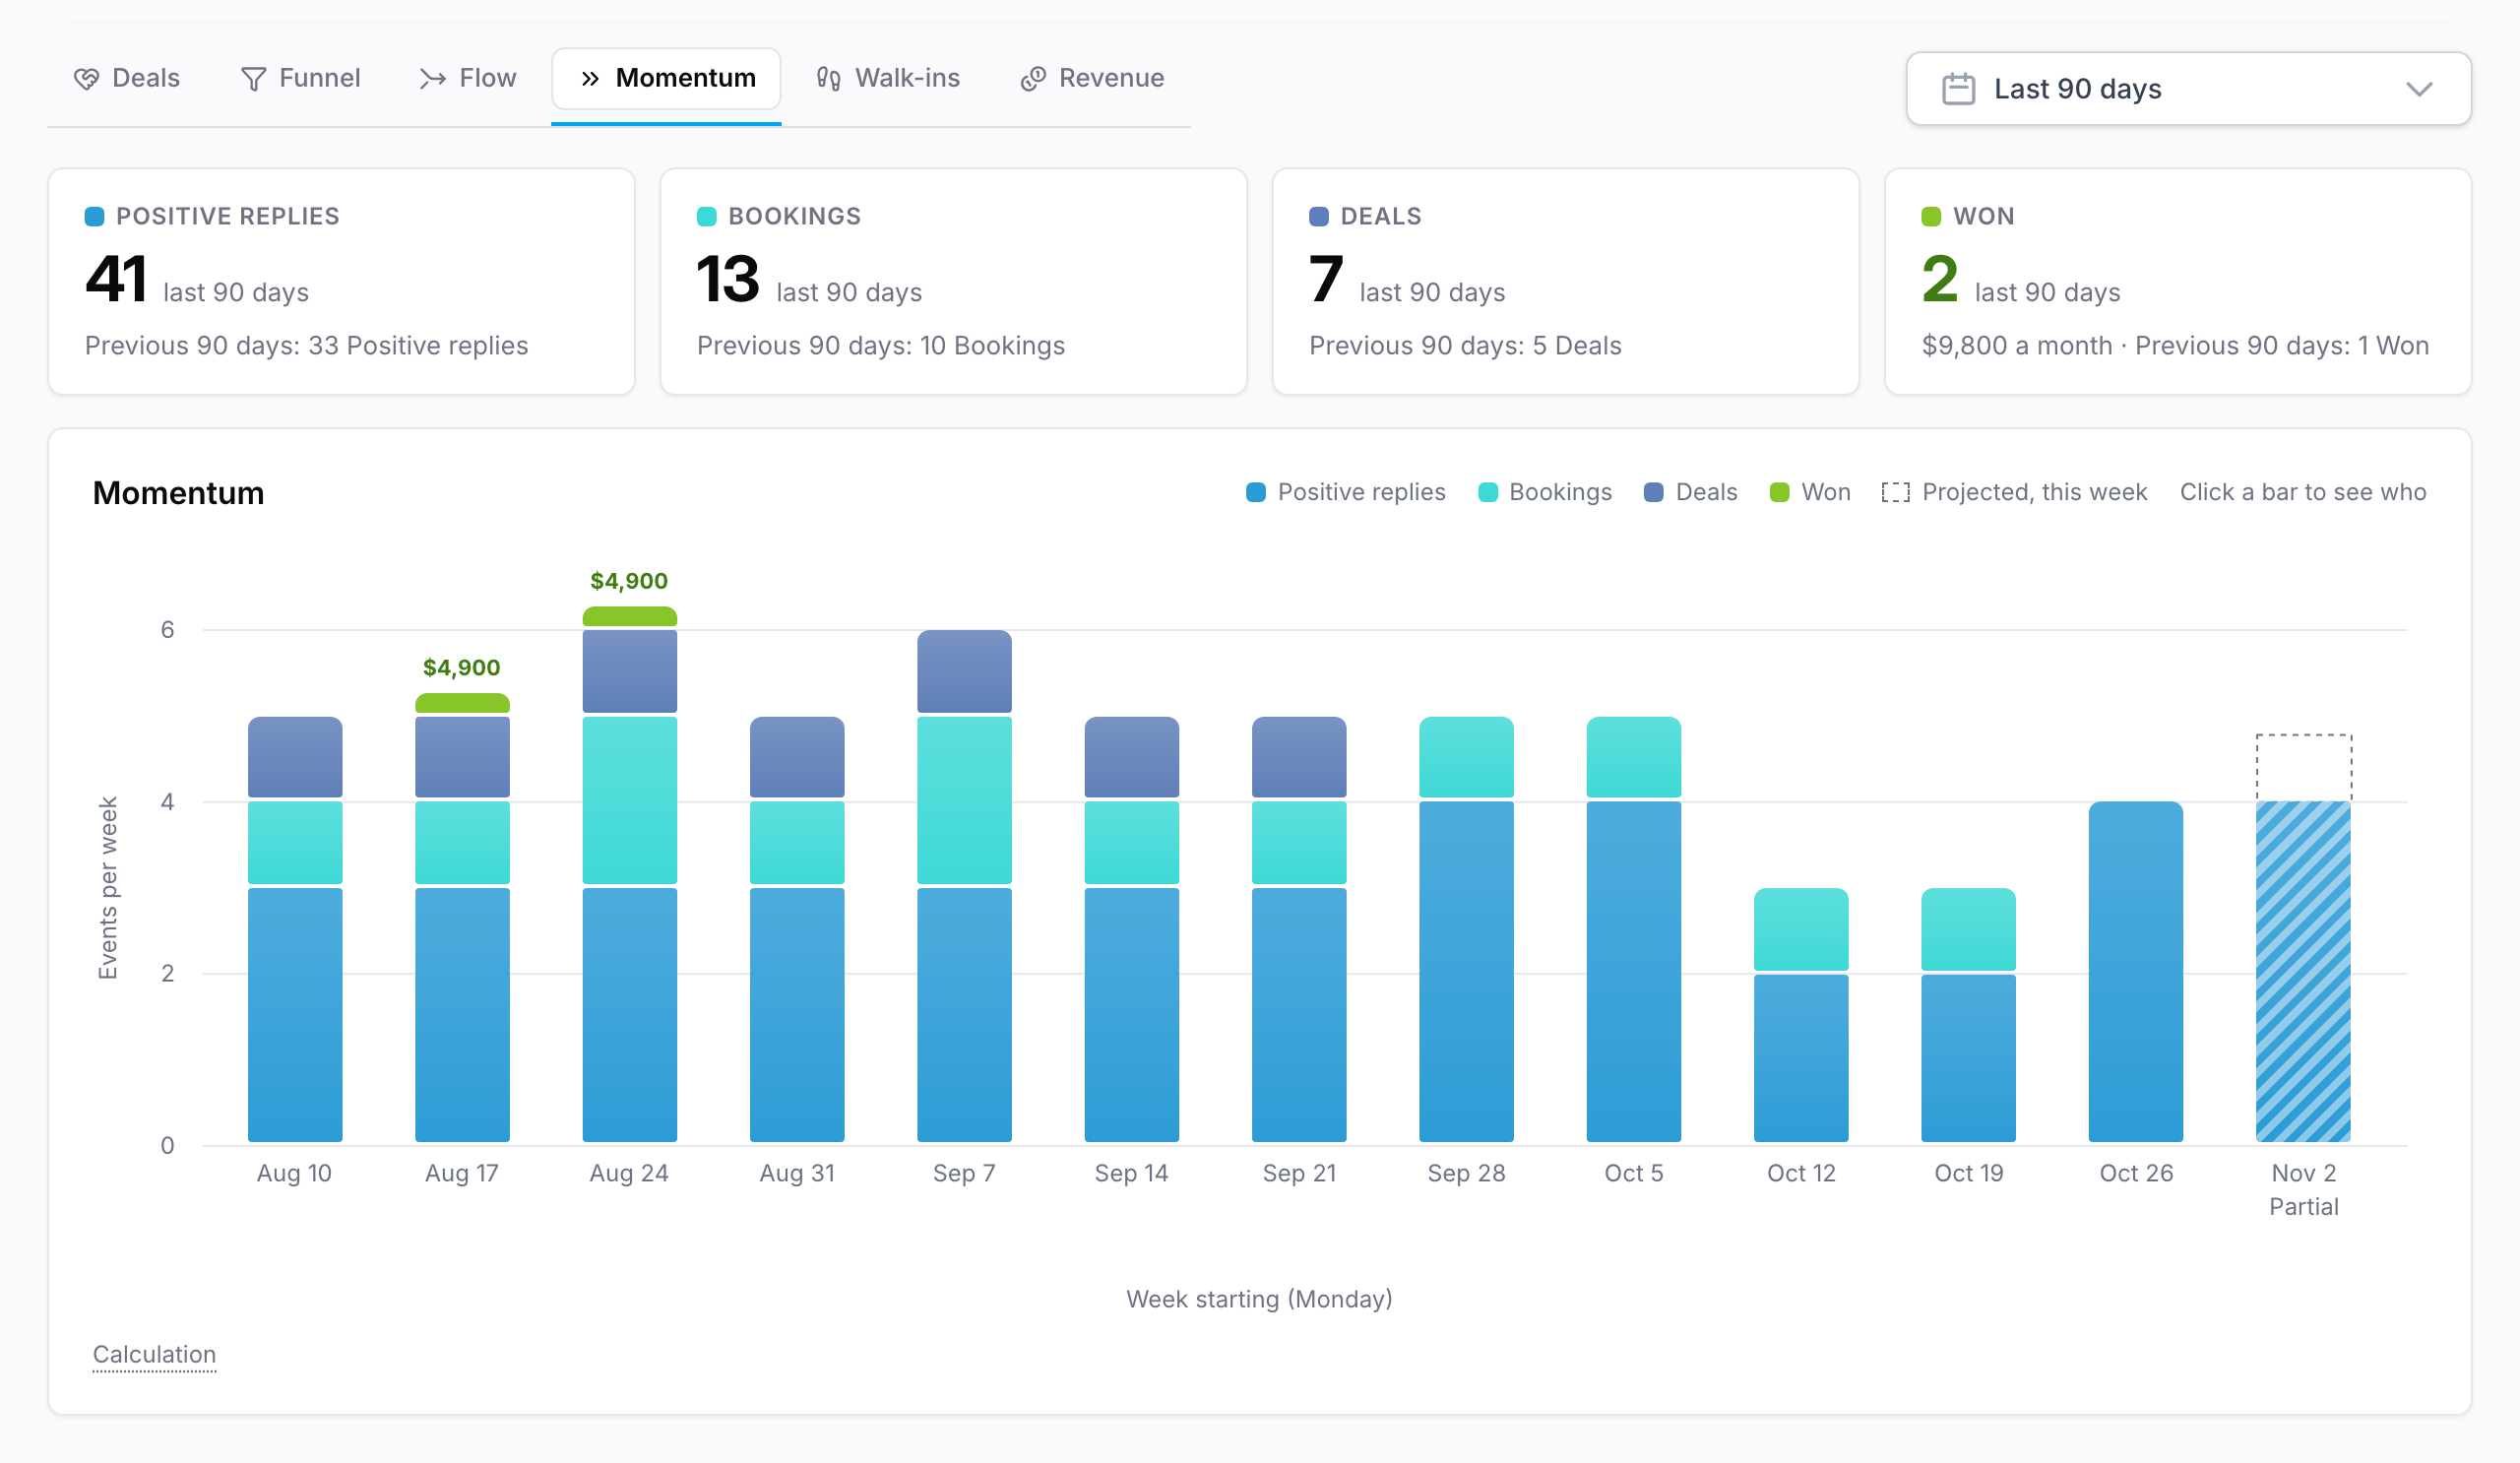
Momentum opens on the last 90 days. Compare stage counts over time and against the preceding period where comparable history exists.
Conversations are grouped by their first Positive reply, with their reached milestones shown for that group. That lets you compare how outreach from different periods develops. It isn’t a count of the calls made or deals won during each week.
Partial periods are labelled. A projection, where available, extends the observed pace to the end of the period. It doesn’t change the recorded counts or predict how much revenue you’ll win.
Keep one view of attributed revenue
Deals and Revenue use the same stored deal facts. Assists stay separate from attributed totals. Recurring amounts and one-off sales stay separate too, so you can read the figures without treating every sale as recurring revenue.
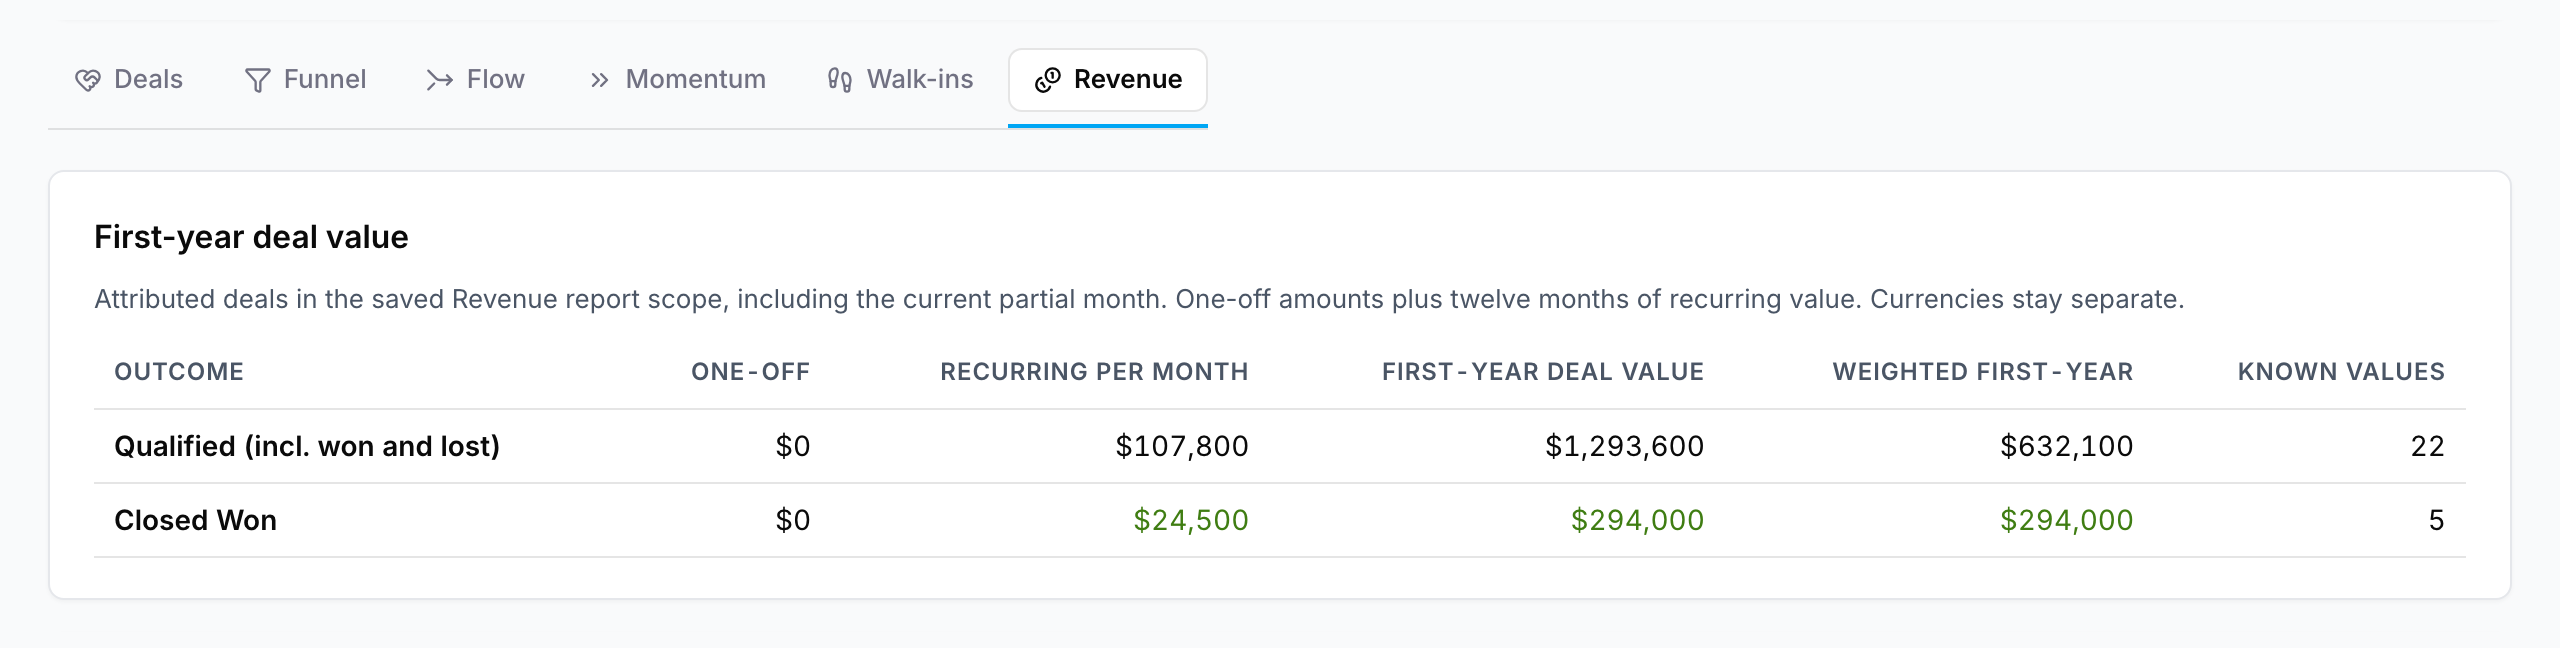
The reports answer different questions, so their totals aren’t always interchangeable. The Deals Board groups by furthest stage, while Funnel retains milestones reached. Choose the same dates when comparing reports, and use Calculation to check the scope of a figure.
The Deal Slack Report brings weekly progress and follow-up needs into Slack, using the same deal facts. Open Reports › Commercial to review the conversations behind your pipeline.
Brought to you by:
Sam Tuke
Chief Executive Officer
SHARE THIS POST
Keep reading
Browse all posts
Start sending in 7 days.
Up to 7,500 emails daily with express warmup.
You must be logged in to post a comment.